
These Are the Last Great Retirement Income Stocks in America
In 1985, the average stock paid 4.2%. Today it pays 1.07%. I own 40 income holdings that never got the memo — and one of them is paying me 14.66% a year on every dollar I put in. Seven are still open to you today.
From the Desk of Nathan Slaughter Chief Investment Strategist, High-Yield Investing
Dear Reader,
I want to show you a number I calculated myself a few weeks ago, because I didn’t believe the one I’d been quoting.
For years I’d been telling readers the S&P 500 yields “about one and a half percent.” Ballpark. Close enough for a newsletter.
Then I actually ran it — trailing twelve-month distributions against the market close — and the real figure came back at 1.07%.
If your savings are supposed to carry you through retirement, that number is about you.
Now, most people see that number and get gloomy about it.
I had the opposite reaction. And I want to explain why, because it’s the reason I’ve spent the last several months hunting rather than fretting.
That 1.07% isn’t a warning label. It’s a price signal. It is the market telling you, in the plainest terms available, that the thing I’ve spent nineteen years hunting — reliable, spendable cash income — has become genuinely scarce.
And in nineteen years of doing this, I have never once seen scarcity make an asset less valuable.
Think about what happens when something people need gets scarce. Good farmland. A lake lot. A pension that actually pays. Whoever already owns one doesn’t let it go cheap. That’s what is happening to a dependable 4% dividend.
Everything Costs More. Your Portfolio Pays Less.
Hold a ruler against this and look where it goes next.
| Era | Average S&P 500 yield |
|---|---|
| 1980s | 4.2% |
| 1990s | 2.2% |
| Today | 1.07% |
Look at what happens between those rows. Not a decline — a halving. Twice. About a generation apart each time.
Here is the same collapse counted a different way.
Fifty-six, out of five hundred — about one in eight, and the list gets shorter almost every year. And if you want 5% or better, the number is nineteen. Six percent or better: seven.
See the seven stocks paying 4% →
I suspect that trend feels familiar even if you’ve never seen it charted. Pensions became 401(k)s. Savings accounts stopped paying enough to notice. A house stopped being something a young family could simply decide to buy. And somewhere in there, without any announcement, owning a piece of an American business stopped meaning drawing an income from one.
None of that is nostalgia talking. It’s arithmetic. But I understand why it feels like more than arithmetic — because every one of those changes moved you a little further from anything you could hold.
I won’t pretend to know precisely where the line stops. Nobody does, and any analyst who gives you a date is selling you something. But there is no floor at zero-point-something — a great many companies already pay nothing at all.
If reliable income is the one thing the market produces less of every single year — what is a dependable 4% payout going to be worth in ten years, when the index pays one? In twenty?
You Built an Orchard. The Usual Plan Is to Cut It Down.
It won’t cover the groceries, the gas, or a plane ticket to your granddaughter’s birthday.
When I show people that chart, the first thing they say is some version of: well, business must be worse than it used to be.
It isn’t. Not remotely. S&P 500 companies paid out a record $630 billion in dividends in 2024 — about $1.7 billion in cash every single day.
So why is the yield lower than at any point in a century and a half, bar a handful of months?
Partly honest arithmetic: prices ran faster than payouts. But the bigger reason is that the share of profits companies choose to hand their owners has fallen. Payout ratios have slid to about 37%, against a twenty-year average closer to 42%.
The rest goes to buybacks. In 2024, a record $943 billion of them.
Where the cash goes
For every dollar of cash sent to shareholders as a dividend, corporate America now diverts about $1.50 into buybacks. Apple paid about $15 billion in dividends in its 2024 fiscal year — and spent $95 billion buying back its own stock.
Buybacks aren’t villainy. When a good business buys its own stock cheaply, every remaining owner gets a little richer. I’m telling you something simpler, and much harder to argue with.
You cannot eat a share buyback.
Think of it as an orchard. A dividend is the fruit — it arrives every season, you take what you need, and the trees are still standing when you’re done. A buyback makes the orchard itself more valuable. Fewer trees, better trees, a higher price per acre. That’s genuinely good, right up until the moment you actually need money — because the only way to convert it into something you can spend is to sell part of the orchard.


Do it once and it’s fine. Do it every year for twenty years of retirement, and you have spent two decades cutting down the apple tree to pay the mortgage on the apple farm.
Here’s the part that bothers me most. You spent forty years planting that orchard. Every paycheck you didn’t spend, every raise you saved instead of enjoying, every year you said “later.” And the plan most retirees are handed — sell a little every year and hope it lasts — is a plan to take it apart, one tree at a time.
Whatever is left at the end is whatever survived the cutting. That’s what goes to your kids. Your grandkids. Your church, the causes you care about. Not what you built — what’s left of it.
You didn’t work your whole life to sell everything you worked for.
Why Companies Would Rather Buy Back Stock Than Pay You
Follow the CEO’s paycheck. It explains where your dividends went, and why they won’t come back on their own.
The buyback boom isn’t a fad, and it isn’t an accident. It comes down to how the people running these companies are paid.
Nearly four of every five dollars a big-company CEO takes home now arrives as stock rather than salary. Twenty years ago it was about two in three.
Put yourself in that chair for a moment. Your own pay rises and falls with the share price. You have a pile of spare cash. You can send it to the owners as a dividend — which does nothing for the share price — or you can buy back stock, which shrinks the share count, lifts profit per share, and nudges the price up. It doesn’t take a villain to pick the second one. It takes a pay plan.
That isn’t my theory. It’s in the research.
• Researchers writing in the Journal of Financial Economics found that companies about to fall just short of Wall Street’s profit-per-share forecast are more likely to buy back stock to hit it — and then cut jobs and investment.
• A second study found that buybacks rise in the very quarters when a CEO’s stock awards are due to vest.
• When an SEC commissioner’s staff checked 385 buyback announcements in 2018, a top executive sold shares within a month in about half of them.
And it has survived every attempt to slow it down. Since 2023, companies have paid a tax on every buyback. Buybacks set new records anyway: more than $1 trillion in the twelve months to September 2025, against about $665 billion paid out as dividends.
Notice what that does and doesn’t mean. The dividend isn’t disappearing — in dollars, it keeps setting records. What’s shrinking is your share of the cash. The money is there. It’s being sent somewhere you can’t spend it, by people who are paid to keep sending it there.
None of this is your fault. You bought good companies. They just stopped being built to pay you.
So I’m not waiting for the index to rediscover the dividend. The companies still built to hand their owners real cash aren’t going to multiply. So the question isn’t whether the index will start paying again. It’s where the income went.
Sources: Economic Policy Institute, CEO realized pay 2024; Almeida, Fos & Kronlund, Journal of Financial Economics (2016); Edmans, Fang & Huang (2022); SEC Commissioner Robert J. Jackson Jr., June 11, 2018; S&P Dow Jones Indices, December 18, 2025.
The Income Didn’t Leave the Market. It Left the Index.
Fifty-six out of five hundred is the whole problem. It is also the whole opportunity — because the S&P 500 is not the market.
It’s five hundred of the largest companies in one country, weighted heavily toward the handful that have most enthusiastically decided you don’t need the cash.
Step outside it and the picture changes completely. There are businesses paying six and seven percent that have kept raising their distributions through downturn after downturn. Companies that pay every month instead of every three. Partnerships whose entire purpose is moving cash to their owners.
Partnerships come with one catch: a tax form called a K-1 that often arrives late, sometimes after you’ve filed. It’s the reason plenty of income investors avoid them altogether. You don’t have to. Of the fifty-five holdings in our portfolio, only three send one, and there’s a simple way around each.
So why is it still there? Why hasn’t it been picked over?
I’ll be straight with you, because this is the honest catch. When you step outside the index, you take on work. These companies are less followed. Fewer analysts cover them — some have none at all. They don’t get talked about on television, and a few have structures that take real effort to understand.
Those yields still exist precisely because nobody is looking. An opportunity everyone can see, requiring no work to find, does not stay a 7% yield for very long.
Somebody has to pull the filings, read the footnotes, check whether the distribution is actually covered by cash flow or quietly funded by debt, and find out what happened to that payout the last three times the economy turned. For nineteen years, that somebody has been me. Before that, I managed money for private clients at Raymond James. I left to put the same research in front of ordinary investors instead.
How I Tell a Real Yield From a Trap
The highest yields on the board are usually a warning. I recently ran the screen an ordinary investor might run — highest yields, nothing else. Here is what came back at the top:
| Company | Yield |
|---|---|
| Orchid Island Capital | 27.7% |
| Dynex Capital | 19.3% |
| AGNC Investment | 17.1% |
| Ellington Financial | 13.7% |
Trailing twelve-month dividends against the closing price on October 19, 2026.
Not one of those is in my portfolio, nor will be. All four are mortgage REITs whose payouts are driven by interest rate spreads rather than an operating business — and every single one has cut its dividend before. A screener cannot tell you that. The yield column looks magnificent right up until the payment is reduced and the share price follows it down.
So nothing enters the portfolio without clearing five tests: a proven business model, surplus cash flow, an expanding bottom line, conservative management with a demonstrated habit of returning cash, and — the one that disqualifies the most candidates — proof it kept paying through the hard stretches.
Fail one and it doesn’t get in. And if a holding stops clearing them later, you hear it from me.
Seven Stocks Still Paying What the Whole Market Used To
Run all five tests across the market and very little survives. Here is what does.
Today the High-Yield Investing portfolio holds 55 income stocks and funds that have cleared that screen. Together they yield about 5.8% — more than five times the index. Forty of them pay 4% or better. Fifteen pay every month.
Most of them sit where the index doesn’t look: lenders to private businesses, owners of property, pipeline and infrastructure partnerships, and income funds that bundle dozens of payers into a single holding.
From those, I picked the seven I’d hand to anyone who asked me where to start, and put them in a new report, The Last 4% Yields in America. I won’t name them on this page — that wouldn’t be fair to the people who pay for this research. But I can tell you what they are.
- America’s largest energy midstream partnership. It moves oil and gas and charges by the barrel, so it cares far less than you’d think about what oil costs. We locked in 14.66% in 2007. A buyer today still collects about 6.1%.
- A lender to mid-sized private businesses that pays every single month, adds a bonus payment on top every quarter, and hasn’t reduced its regular monthly dividend since it went public in 2007. About 8.2% today, counting the bonuses.
- A large business lender filling the gap the banks left when they stepped back from lending to mid-sized companies. It yields more today — 10.4% — than on the day we bought it.
- A monthly-paying property trust that has sent its owners more than 375 monthly dividends since 1994. About 6% today. We locked in 8.25%.
- An owner of casino and entertainment real estate — the landlord, not the gambler. In September 2025 I sold part of it at a 104.9% gain and kept the rest. It still yields about 7.9%.
- A global packaging maker whose yield today, 6.2%, is higher than the 5.2% we locked in.
- A household-name delivery company based in Atlanta whose share price has fallen far enough that a new buyer gets a better yield, 6.9%, than we did.
Together they average more than 7% — nearly seven times what the index pays.
Three of the seven pay more today than the day we bought them. For those three, the door hasn’t started closing.
For the other four, you’re still buying in at several times the market’s rate — just not at ours. Every pick in the report carries its door: the yield we locked in, the yield on offer today, and an honest note on what would have to go wrong.
And because owning them is only half of living on them, the second report, The 52-Week Income Calendar, lines up these seven and the rest of the portfolio so a payment lands in every week of the year.
The Market’s Yield Changes Every Day. Yours Never Does.
Those doors are why timing matters. When you buy, you fix your cost basis for good — at a rate the market may never offer again.
That’s what scarcity does for income you already own. Every year the market pays less, the rate you locked in is worth more, because fewer and fewer people can get it.
Every dividend a company pays from the day you buy is measured against what you paid, not what the next buyer pays. We call it yield-on-entry, and I track it for every position in the portfolio.
Which means that while the market’s average payout has been sliding toward zero for forty years, the yields our readers locked in years ago have been doing the opposite.
| Position | Yield today | Our yield on entry | Held since |
|---|---|---|---|
| A global infrastructure partnership | 5.08% | 15.76% | 2011 |
| America’s largest energy midstream partnership | 6.10% | 14.66% | 2007 |
| A lender to mid-sized private businesses | 8.17% | 14.37% | 2015 |
| An energy-infrastructure services company | 2.91% | 13.08% | 2018 |
| A major North American energy producer | 2.38% | 11.91% | 2020 |
| A monthly-paying net-lease property trust | 5.95% | 8.25% | 2013 |
A new buyer of that midstream partnership today collects 6.10%. We collect 14.66% — same stock, same dividend, same day. The only difference is that we bought it in 2007 and never let go.
Every entry yield in that table is a rate the market no longer offers. You cannot buy it at that rate today. That door closed in 2007, and it closed for good.
This is why I don’t put a countdown clock on anything I write. I don’t need one. The scarcity here isn’t a marketing device — it’s forty years of data pointing one direction, and a cost basis that fixes itself the moment you act.
$49 for your first year · 90-day money-back guarantee
The Raise Nobody Had to Ask For
A price chart proves somebody made money. For a retiree, the proof that counts is the payment.
So here is the test I’d want if I were the one reading this letter. Not what these stocks did. What they paid.
Take the 37 dividend-paying stocks in the portfolio today — the companies, partnerships, property trusts and business lenders, leaving the funds aside. Over the last twelve months:
Go back five years, and 32 of the 35 that were paying then pay more now. Go back ten, and it’s 28 of 32. Spread $10,000 evenly across them five years ago, and the income it throws off today would be about 31% higher. Ten years ago, about 58% higher. Nobody had to ask for a raise. The businesses simply kept handing them out.
America’s largest energy midstream partnership · bought February 2007
$10,000 bought 669 units. In the first year they paid $652. Over the last twelve months they paid $1,476 — more than double, from the same units. All told, that $10,000 has paid $20,617 in cash so far, about twice what it cost, and we still own every unit.
And through the hard stretches: of the holdings that pay a plain dividend — no special payments to blur the picture — not one cut its payout in 2022. In 2020, one did.
I’ll be clear about what this is. These are the stocks we own today. The ones that stopped paying aren’t in this count because they aren’t in the portfolio anymore — and I list them, losses included, just below the order form. Funds are left out because their payouts float with the markets; two of our fourteen pay a little less than they did a year ago.
Dividends per share from company records via Yahoo Finance, checked against company filings for several holdings, as of October 14, 2026. 37 common stocks, partnerships, REITs and business-development companies held today; funds and preferred shares excluded. The 2007 example assumes no reinvestment. Past payouts do not guarantee future ones.
While the Payments Grew, the Shares Kept Growing Too
A rising payment is the point. But you’d also want to know the shares underneath it held their ground while they paid you.
Here’s what three of our longest holdings did while they sent those payments:
An energy midstream partnership · held since February 2007
Up nearly 400% since we bought it, and still paying every quarter.
A global infrastructure partnership · held since December 2011
Grain and coal railways in Australia. Power transmission in South America. Port terminals in the United Kingdom. Roughly 80% of cash flow locked in by regulated rates or take-or-pay contracts. Fifteen years and more than $20 a share in cumulative distributions later, it has returned better than 380%.
A pipeline partnership · an eighteen-year hold
Returned 610% before it was acquired out from under us in 2023.
When something runs that far, I don’t sell it. In September 2025 I took some profit on four of our longest holdings, one of them up more than 300%, and kept every one. Those trims don’t count in my record either. Counting only positions I sold out of completely:
Of the last fifteen, thirteen finished at a gain.
Over the past three years, twenty of twenty-six. Both counts move every time a position closes — and the ones that lost money, including one that cost us nearly half, are listed in full just below the order form. A record without its failures isn’t a record.
Every Share You Sell Is One That Never Pays You Again
There’s one more reason not to wait, and it’s on your calendar, not mine.
Every year you sell to cover the bills, a little more of what you built comes down. The shares you sell this December are gone for good. They’ll never pay you again. They’ll never get a raise. They’ll never go to your kids.
If your savings sit in an IRA or a 401(k), you don’t even get to choose the pace. Once you’re in your seventies, the government sets how much has to come out every year, and the amount goes up every birthday.
The day your income comes from what your stocks pay, the selling stops. What comes out each year is what the trees produced, and the orchard stays standing.
That’s why I’d rather you start this year than next. Not because of anything I’m selling, but because of every share between now and then.
So here’s exactly what I’d hand you to make that switch:
- The Last 4% Yields in America: the seven stocks to start with.
- The 52-Week Income Calendar: how to line them up so a payment lands every week of the year.
- The K-1-Free Income Portfolio: which holdings send that late tax form, and what to own instead.
- A full year of research that tells you the moment anything changes.
Required withdrawals apply to traditional IRAs and most 401(k)s, not Roth IRAs, starting at age 73 or 75 depending on your birth year. Dividends are not guaranteed. Not tax advice.
$49 for your first year · 90-day money-back guarantee
Everything included today
Here’s Everything You Get
The three reports you’ve been reading about, yours the moment you join, plus a full year of research.

Flagship report
The Last 4% Yields in America
Seven income stocks still paying what the entire market used to — and what each one yielded on the day we bought it. Every pick carries its door: the entry yield that was available then, the yield on offer now, and an honest read on how much room is left.
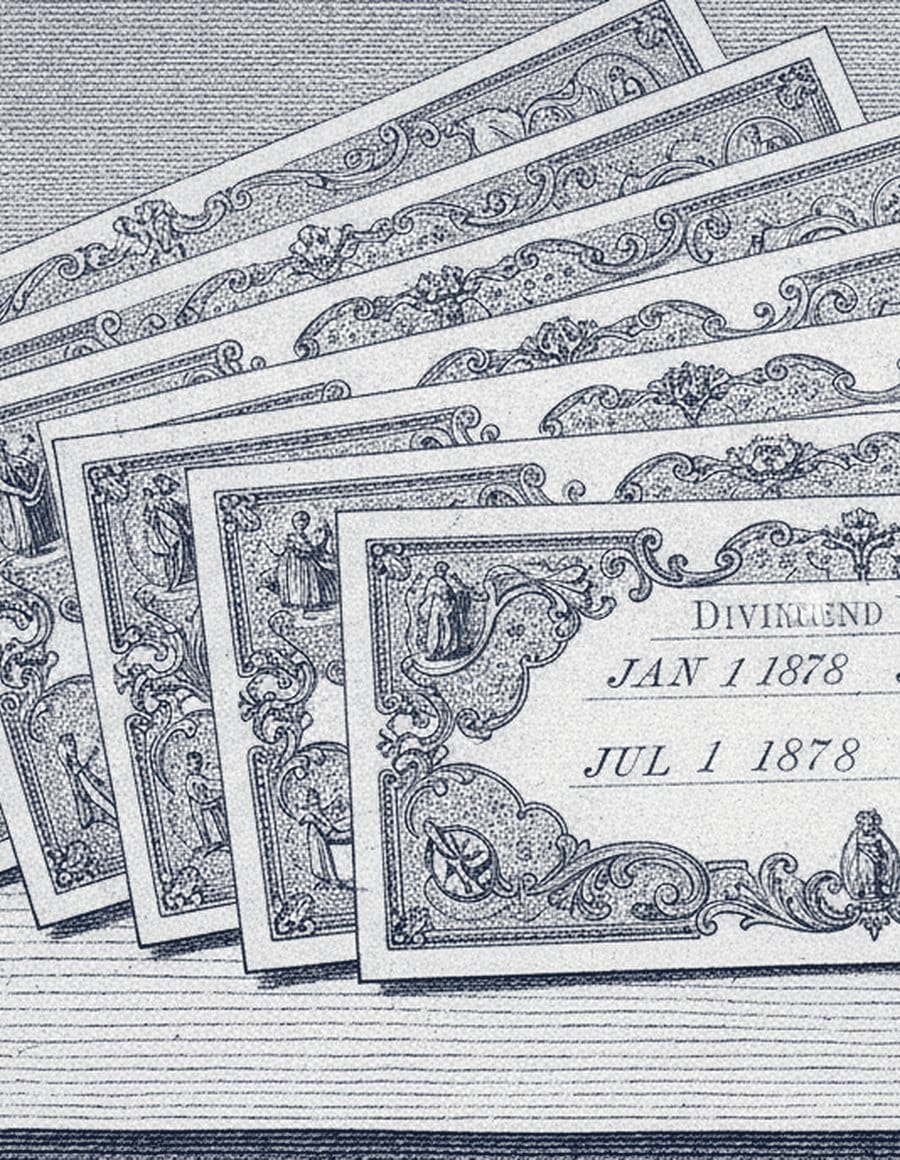
Bonus report #1
The 52-Week Income Calendar
Most dividends land quarterly, leaving long stretches of nothing. This shows you how to sequence what you own so a payment arrives in every week of every month — using nothing but holdings from our own portfolio.

Bonus report #2
The K-1-Free Income Portfolio
If you’ve ever owned a partnership you know the routine: the K-1 arrives late, sometimes after you’ve filed. Out of fifty-five holdings, exactly three send a K-1. Here is which three, what to do about each one, and the K-1-free twin of our largest that pays the identical distribution.
Plus a full year of High-Yield Investing:
- A new issue every week on the income stocks in the portfolio: what to buy, what to hold, and what’s changed.
- An alert the moment something affects your income: a raise, a cut, a reason to sell.
- The yield you actually lock in, for every stock. Most services show you today’s yield. We show what each stock pays on the price it was recommended at, so you can watch your income grow.
- The full archive of past issues, searchable any time.
A Full Year Is $49
It normally runs $129. Here’s why I’d rather have you as a reader than have your money.
Given that a single one of these recommendations could reasonably add tens of thousands of dollars of income over the years you hold it, I could justify asking $1,000 for access. That’s not what I want this to be. The whole point — the reason I left the private client business — was to put this research in front of people who’d actually use it. That only works if the price isn’t the obstacle.
Let me price it the way you’ve been thinking all letter. At our portfolio’s 5.8% average yield, $49 is roughly the annual income thrown off by about $800 of capital.
Here’s what happens the moment you join. All three reports are yours to read tonight: the seven stocks, the 52-week calendar and the K-1-free list. Your first weekly issue arrives within days. And if any of it isn’t what I’ve described, you have 90 days to ask for every penny back, and you keep the reports.
That’s less than a dollar a week, against the plan most retirees are living with now: selling a few more shares every year and hoping it lasts.
Keep What You Built
Picture next December.
The payments have been arriving all year — one in every week, the way the calendar lays them out. A few of them got a raise along the way, without you asking. When the year-end withdrawal comes due, it’s already sitting there, paid for by what the trees produced.
You didn’t sell a thing. You didn’t watch the market to pick a good week to sell. You didn’t cut down a single tree.
And the orchard is still standing. Whole. Still paying. Still yours to hand to your kids, your grandkids, your church, whoever you choose — not what’s left of it after twenty years of cutting, but the thing itself, the one you spent your working life building.
That’s what you worked for. Not a pile to spend down. Something that keeps paying, and keeps going after you.
It starts with seven stocks still paying what the whole market used to — three of them paying more today than the day we bought them — and a calendar that lines them up so a payment lands every week of the year. All of it, plus a full year of my research, is $49. If it isn’t what I’ve said it is, you have 90 days to get every penny back, and you keep the reports.
The income stocks still paying the old way get scarcer every year. The ones you own today are the ones that get more valuable to hold.
Keep what you built. Let it pay you. Then pass it on.
Nathan Slaughter
Chief Investment Strategist, High-Yield Investing
Start Your Membership
New member rate
One full year of High-Yield Investing
Please read this before you order. Your membership is one full year of High-Yield Investing for $49. After that first year it renews automatically at $129 a year, charged to the card you use today. We will email you before that happens, and you can cancel any time. Cancel inside the first 90 days and you get every dollar back and you keep all three reports.
Less than a dollar a week · 90-day money-back guarantee
90 days. Every penny back. And you keep everything.
The first 90 days are on me. Join today, download all three reports, put the recommendations to work, and take the full measure of it. If at any point in those ninety days you’re not completely satisfied — for any reason, or for none — contact my customer service team and I’ll refund every penny of your subscription.
After that, you’re still covered. If somewhere down the line you decide this isn’t for you, let us know and we’ll refund the unused portion.
Either way, you keep everything. All three reports, every issue, every ticker symbol I’ve sent you. Reach us any time at customerservice@investingdaily.com.
“I’m Already Retired. Haven’t I Run Out of Time for This?”
It is the question I get most often, and the honest answer is better than people expect.
I understand where it comes from. I have spent this whole letter talking about 2007, about doors that closed nineteen years ago, about what a cost basis becomes after two decades of raises. If you are sixty-eight, that can read as a story about somebody else’s good fortune.
So let me take the argument apart.
A yield pays you in year one. If you buy something today at 7.8%, it pays you 7.8% this year. Not in year thirty — this year, in cash, into your account. The compounding I have been describing is what happens on top of that if you hold. It is the bonus, not the premise. Nobody has to wait two decades for the money to start arriving.
The raises start immediately too. A company that lifts its distribution 5% a year lifts yours 5% a year from the first one. Five years of that turns 7.8% on your money into roughly 10%. Five years is not a young person’s timeframe.
And this is the part people miss: a retiree is the person this suits best, not worst. You are the one who actually needs cash arriving on a schedule rather than a number on a screen you would have to sell into to spend. Everything in this letter about not cutting down the orchard is written for somebody who is living off the orchard right now.
The reader with thirty years ahead of them gets more out of the compounding. The reader who needs to eat this year gets more out of the income. The first group can afford to wait. The second cannot, which is exactly why they should not be holding things that pay them 1%.
What You Won’t Get From Me
I’d rather lose you on this page than have you join and find out in March.
This is not a trading service.
No options, no leverage, nothing with an expiry date, no positions you have to watch during the day. In a normal year this portfolio changes very little, and that is the product rather than a shortcoming of it. Every trade costs you something in spreads and taxes. Doing fewer of them is a feature I charge for.
It will not keep up with the market in a roaring bull run.
It isn’t built to. A portfolio assembled around companies that hand you cash every quarter will lag a market being carried by companies that hand you none. If what you want is the maximum possible number at the end of thirty years, buy an index fund and stop reading. What you get here instead is money arriving while you wait.
It is not protection against a crash.
I want to be blunt, because our industry is dishonest about this constantly. High-yield securities are not a hiding place. In March 2020 several of the things I own fell further than the S&P 500, and the portfolio dropped below $80,000. What a dividend does in a downturn is keep paying you while the price is down — and it does one more thing, which is hand you cash to spend when everyone else is selling. That spring I added twelve positions between March and May, and all twelve finished 2020 in the green. The portfolio ended that year up about 4%, against 1.2% for the Russell 1000 Value Index, and closed at $124,700 — a 55% rebound from the March low. In 2021 it grew to about $160,000, up 28.8% and ahead of the S&P 500. Then came the real test. In 2022 the S&P 500 fell nearly 20%, the Nasdaq 32%, and bonds had one of their worst years on record. This portfolio slipped about 2%. That is not protection, and I won’t call it that. It is what a portfolio built to keep paying does in a bad year, and it is the part of the record I’d show a nervous investor first.
We have losing positions, and I don’t hide them.
Two of the last fifteen positions I sold out of completely lost money, and they weren’t small. Whirlpool didn’t perform the way I expected and went out at a loss of 48.9% — nearly half our stake. LyondellBasell went out 43.3% down. Go back a little further and you’ll find ManpowerGroup (down 20.9%), Apple Hospitality (16.7%) and VF Corp, another disappointment that stuck with me long after I hit the sell button.
Widen the lens to everything sold out of completely since the start of 2020 — six years that include the 2020 crash, when I cleaned out nearly twenty holdings in a single year, and the 2022 bear market. 55 of 81 finished at a gain, five with triple-digit returns. The 26 that didn’t are in the same table as the winners. You will see losers in your own account eventually.
And nothing here is a guarantee.
Dividends are declared by boards of directors, one quarter at a time, and boards cut them. What I can promise is the five-point screen you just read about, run on every holding, and an alert the moment one of them stops clearing it.
Closed-position counts are full exits only, as of 14 October 2026, and move whenever a position closes. Portfolio values are the High-Yield Investing model portfolio as reported in the letter’s year-end issues of 18 December 2020, 21 December 2021 and 20 December 2022. Past performance is not a guarantee of future results.
I Left Wall Street Because I Was Tired of Making Rich People Richer
Nineteen years ago I walked away from managing money for people who already had plenty of it.
I started at AXA/Equitable Advisors, one of the largest financial planning firms in the country. From there I moved to Raymond James Morgan Keegan, where I managed millions of dollars for private clients.
I was good at that job. I also came to resent what it asked of me — missing birthdays and family dinners so I could help someone who already had more money than he could reasonably spend add another comma to his account. The work wasn’t dishonest. It just wasn’t why I got into this business.
So I left, and joined Investing Daily with one goal: take the same caliber of income research I used to reserve for private clients, and hand it to ordinary investors instead.
“I’m a relatively ‘small-time’ (i.e. not aggressive) investor and was happy to record a 112% gain on [one holding]… and currently have a 58% capital gain on [another]… I have been and am currently enjoying the dividend earnings over the years from [three more].”
— Bob Brackbill, Ellicott City, MD (September 2021)
“My Roth was up 38% and my IRA was up 28% this past year.”
— Leon Korkowski, Ann Arbor, MI (January 2020)
“One of the partnerships made me about 24% in less than six months. Another gave me a combined return of over 35% in under a year. I also took a 5% loss on one of the others.”
— Andi Valachi, Ottawa, Canada (2015)
That last line is why I included her. Not every recommendation works. Anyone who tells you otherwise is managing your expectations rather than your money.
Individual results are not typical and will vary. Past performance is not a guarantee of future results. Testimonials describe individual positions and personal opinions, not the returns of the service, and are not representative of any subscriber’s experience.
Before you join
Questions People Ask Me
What do I actually get today?
Immediate online access to all three reports, plus a full year of High-Yield Investing issues, ongoing portfolio updates, members-only alerts, and the complete research archive.
How much money could I make?
I won’t give you a number, and you should be wary of anyone who does. What I can show you is what’s actually happened: 55 income positions averaging 5.8% against a market paying 1.07%, thirteen of the last fifteen positions we sold out of completely finishing at a gain, and long-held names up nearly 400%. Past performance is not a guarantee of future results, and dividends can be reduced or eliminated at any time.
Do I need a lot of money to start?
No. Every recommendation is an ordinary security you can buy in whatever brokerage account you already have. There’s no minimum and nothing to qualify for.
I’m not retired yet. Is this still for me?
Arguably it matters more. Yield-on-entry works in your favor the longer you hold — the reader who locks in a rate today and reinvests for fifteen years ends up somewhere very different from someone starting at retirement.
What’s the catch?
The price. I’d rather bring in a large number of readers at $49 and earn the right to keep them for years than charge everyone full freight and reach a fraction as many. There’s no hidden fee and no additional purchase required to use anything in the reports.
What happens after the first year?
Your membership renews automatically at the standing rate of $129 a year, charged to the card you use today. We email you before it happens, and you can cancel any time.
Can I speak to a person?
Yes. Investing Daily’s customer care is staffed by real people in the United States. Reach them at customerservice@investingdaily.com or (800) 832-2330, 9:00 a.m. to 5:00 p.m. Eastern, Monday through Friday.
Is my order secure?
Yes — the order form uses bank-level encryption, and we never sell your email address.
P.S. Three of the seven stocks in The Last 4% Yields in America pay more today than on the day we bought them. If you only act on one thing in this letter, start there — those are the doors that haven’t started closing.
Investing Daily is not a registered investment adviser or broker/dealer. All information is provided for informational purposes and does not constitute personalized investment advice. All investing involves risk, and dividends can be reduced or eliminated at any time. Past performance is not a guarantee of future results. All yields, prices and portfolio counts as of November 2, 2026 and subject to change; they move daily. We encourage readers to supplement this research with independent professional advice before investing. Questions: customerservice@investingdaily.com